What is the best Atlantic salmon river in Iceland?

February 14th by Chad Shmukler
Atlantic salmon are a prized quarry everywhere they swim, but especially in Iceland. Iceland's salmon rivers persist as one of the last strongholds for Atlantic salmon, one of the diminishing number of places where anglers can travel in search of these wild, powerful, elusive fish. But which of Iceland's many salmon rivers is the best?
To say the very least, there is no simple or single answer to that question. But we can learn a lot by looking at the data — and we can have fun doing it. In truth, that's mostly what we're here to do. There is no shortage of pitfalls and holes in the data and methodology we're about to unpack, and no shortage of fine details that get glossed over when you take something as nuanced as annual runs of anadromous fish and reduce it to a handful of charts. So, with that said, let's have a look.
MOST FISH = BEST RIVER?
Whichever river anglers catch the most Atlantic salmon on is the best, right? Not the all-time one year high. That is perhaps interesting trivia, but ultimately not that useful. But what about a look at how many times each river has taken the annual crown for the most wild Atlantic salmon landed?
It's a close call, but the north coast's famed Miðfjarðará — a river many already regard as the best Atlantic salmon river in Iceland — edges out the Thverá/Kjarará and the pair rank a clear cut above the rest.
A BROADER LOOK
Since we all can't fish the same river, it's likely helpful to step back and take a slightly broader view. While the chart above tells us how often a river took home the gold, what about silver and bronze? A look at how often a river finished in the top three should allow us to see a bit more.
Now the west coast's Thverá/Kjarará and Nordurá really start to shine, with the Miðfjarðará following just behind.
BUT HOW BIG AND WHEN?
It's helpful to know how often a river has sat on the annual throne, but it doesn't tell us anything about when or how those big years happened. Being king of the hill mostly during down years wouldn't be much to crow about. And surely if we're to decide what Iceland's best salmon river is rather than was, we need a look at when these rivers led the pack.
The Miðfjarðará continues to make an strong argument for itself. Not only has it had more #1 seasons than any other river in the nation, its big years have been among the biggest — and they've been recent. Very recent. All 14 of the Miðfjarðará's crown-wearing seasons have occurred in the last 17 years.
ANOTHER LOOK AT THE PODIUM
Much like above, a bit of a broader view will tell us more. Let's look at the top three again.
Now we're getting somewhere — and seeing more. The mighty Blanda, another north coast river, which only briefly raised its hand in the charts above starts to shine through — thanks to its mammoth years between 2009 and 2016. And the Thverá/Kjarará, which seemed to fade away after 2007 in the data shown above, is revealed to be a consistent top three performer essentially from 1975 until present day — along with the Nordurá, which also makes frequent appearances on the podium throughout the last two decades.
MISSING PERSPECTIVE
But it's not enough to simply know how many salmon are caught on a given river. Part of what makes a river good or bad, at least from our perspective as anglers, is how many you or I can hope to catch when we fish it. Big rivers typically get far more returning salmon than small rivers, but small rivers can deliver an equal or even better experience — depending on how many people are fishing them. That's where rods come in. Making any sense of the catch data requires taking into account how many rods (anglers) are fishing a river during a given week. 20 salmon caught by 20 anglers over the course of a week isn't particularly exciting. 20 salmon between two rods? Well, that's a different story entirely.
This is an entirely new lens on the data and it tells us quite a bit about how a typical angler performed on each river over time. We begin to get more perspective. Not necessarily a contradictory one, but perhaps a more complete one. We can see clearly that, in terms of the average catch per rod per week, the Laxá á Ásum dominated the landscape from the 1970s onward through the mid 90s. The Miðfjarðará continues to make a strong showing but we start to see rivers that didn't register all that much in the previous charts making strong statements here, most notably the Selá — thanks in no small part to the river's 6 rod limit (as compared to the Miðfjarðará's 10 and the Þverá/Kjarará's 14). The Jökla's big seasons over the last two years are also front-and-center.
ZOOMING OUT AGAIN
Once again, as above, despite the change in metric, it's helpful to zoom out a bit and look at more than just the single top performer each year.
We see even more of the Selá in this view and the Hofsá shows up more here than in any of the previous data. We get a more complete view of the Laxá á Ásum, as well. Where the previous chart might have led anglers to believe that the river's best days were behind it, this zoomed out view shows it has remained amongst the upper echelon of rivers in terms of average catch per rod per week.
THE BIGGER PICTURE
To really get a sense of the bigger picture, however, it's quite useful to be able to compare rivers to each other, not just examine which rivers were each year's top performers.
Definitely another interesting lens on the data and one that really helps us see each river's ebb-and-flow over time. Useful for comparing two or three or even a handful of rivers at a time, but it gets crowded quite quickly and we're still looking at only a single metric.
A BETTER ALL-RIVER VIEW
As interesting as the charts above are, they're still either only offering us small windows into the data or they're poor at allowing us to interpret a lot of data at once. For a more complete picture of all rivers for the entire period of record, we need a better visualization. That's where heatmaps can be useful.
The heatmaps below condense over 50 years of data for every reporting river into a single view, making it possible to spot patterns that no line chart or bar chart can reveal. At a glance, you can see which rivers have been consistently productive, which have declined or surged, and whether those shifts happened gradually or abruptly. The color encoding lets your eye naturally group rivers by performance tier without needing to trace individual lines or compare bar heights across dozens of years.
This is perhaps our best view yet of how each river performs over time, not simply relative to itself or another river or two, but relative to every other river in the data set. And for multiple metrics.
A NOTE ABOUT METHODOLOGY
All of the data above is compiled and derived from publicly available statistics published by Landssamband veiðifélaga (Iceland's National Federation of Fishing Clubs) at angling.is. Due to inconsistencies in the frequency and consistency of weekly reporting from one river to the next, average per rod per week statistics are derived based on a fixed, 13-week season typical of many Icelandic Atlantic salmon rivers. This will disadvantage rivers with shorter salmon seasons (like the Blanda, for instance) and advantage rivers with longer seasons. Readers should keep this in mind.
WHAT'S MISSING?
A lot. In fact, there may be more things this data can't show us than it can.
Rivers
Perhaps most notably, rivers are missing. Not all Icelandic salmon rivers report weekly or annual catch totals to Landssamband veiðifélaga, leaving excellent rivers like the north coast's Hölkná completely unrepresented in the data.
Size and Quality
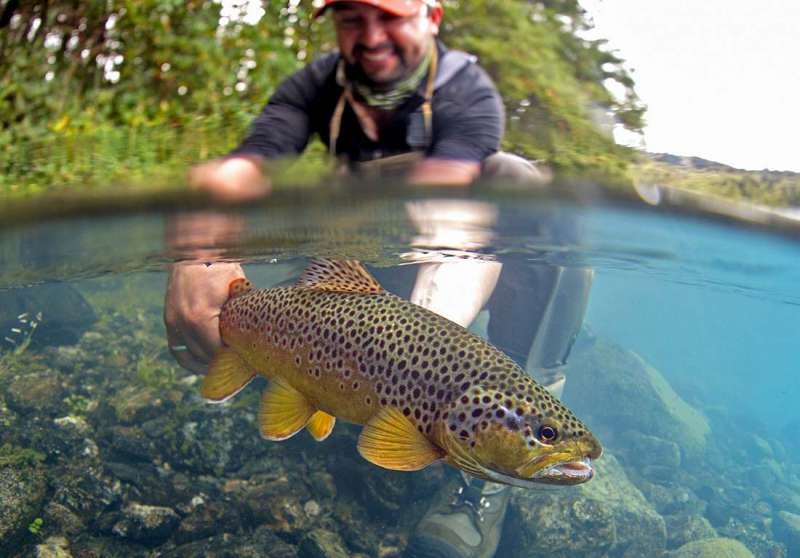
The data here tells us only about the numbers of Atlantic salmon caught. It doesn't tell us anything about the fish anglers encounter on each of these rivers. Does one river yield mostly catches of grilse while another treats anglers to a bounty of large, shouldered, MSW (multi-sea winter fish)? Certainly, that can be the case — and the data here tells us nothing about that.
Run Distribution
Does one river see a consistent run of salmon spread out over the course of the season, or at least the prime part of the season, offering each week's anglers consistent action? Or do most of its fish arrive over the course of just a few weeks, leaving slim pickings during the rest of the season? The data here offers us no insight. For rivers with more consistent reporting, this data could be examined, but due to the aforementioned variability in reporting frequency, that's not addressed here at all.
Angler Experience
Does one river cater to mostly first-time or infrequent salmon anglers while another is fished almost exclusively by salmon-obsessed anglers that rebook every year for decades on end? Surely, when and if that's the case, catch rates would be dramatically impacted.
Fishing Regulations/Techniques
While a large numbers Atlantic salmon rivers, including many of the most consistent performers on this list, restrict anglers to floating lines and unweighted flies, not all do. Some allow weighted flies, sinking lines, or both. This also impacts catch rates, but is not accounted for in the data.
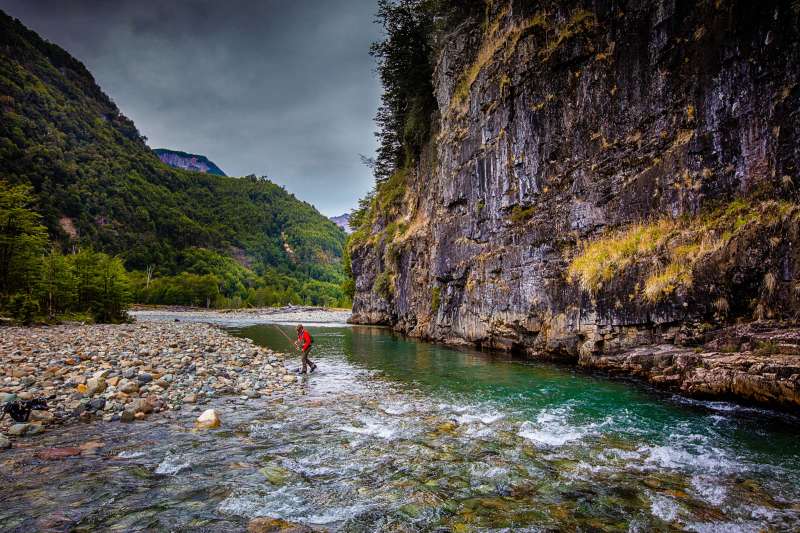
Landscapes
The natural beauty of the places we all travel to chase fish is, at least for most anglers, a big and meaningful part of the experience. Unsurprisingly, this is also unrepresented in the data.
The East and West Rangá
Many readers familiar with Iceland's salmon rivers will note the absence of both the East and West Rangá in this analysis — both rivers that annually produce amongst the highest salmon catch totals in Iceland. However, since this analysis focuses solely on Atlantic salmon rivers with natural, self-sustaining reproduction — the Rangás are not included (and in fact, records for these rivers are maintained in a separate dataset by angling.is).
SO WHICH RIVER IS BEST?
If you've made it this far, you've probably already realized that is not a question that can be easily answered or perhaps not one that can be answered at all. Even if we were to compile more data or refine our analysis, there are simply too many variables at play and too many tangible factors that can't and aren't represented by the numbers entered into each river's log books.
Surely, the data here doesn't tell us what the single best Atlantic salmon river in Iceland is. But it does offer us a fair bit of insight into what rivers rise above the tide, offering anglers the best experience.
THE BEST RIVER IS THE ONE YOU CAN FISH
At the end of the day, the best Atlantic salmon river in Iceland is the one you can swing a line through. This comes down to a number of factors, most notably cost and availability.
Cost
The old adage that "you get what you pay for" applies here, at least to some degree. Fishing one of Iceland's most heralded Atlantic salmon rivers typically comes with a price tag to match the river's reputation. Price per rod per day can vary widely across the landscape of the nation's rivers. If fishing a big name river costs twice as much as fishing a consistent performer, which is the better choice? That's for each angler to judge for his or herself.
Availability
Many of Iceland's top performing salmon rivers offer each year's anglers first right of refusal when it comes to the following year's rods and rebooking rates are typically high. It's not uncommon for popular rivers to have long waiting lists or release only a handful of rods to the public each season. Fishing a productive Atlantic salmon river in Iceland requires planning and preparation — or at the very least, a bit of good luck.
WANT TO FISH ICELAND'S ATLANTIC SALMON RIVERS?
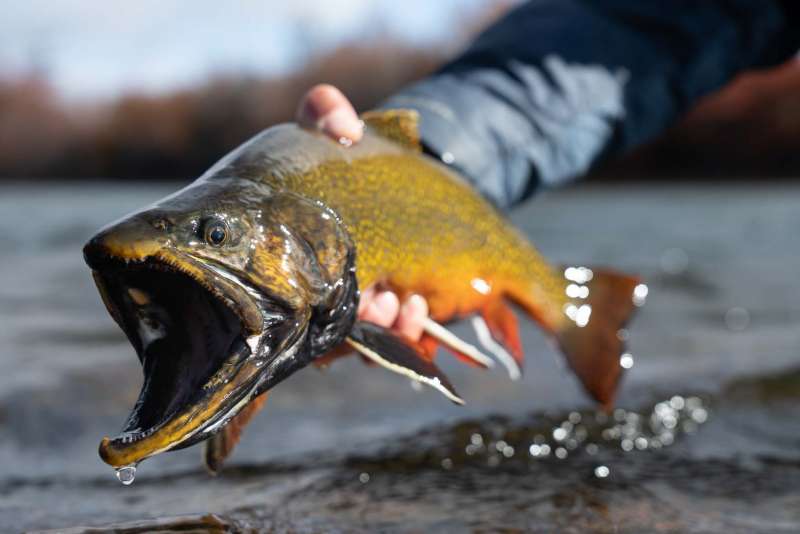
We can help. With relationships with lodge owners and leaseholders throughout Iceland offering excellent Atlantic salmon and sea trout as well as resident brown trout and Arctic char fishing, we can aim to get you on the water.
Drop us a line to learn more or call us at +1 (253)-780-1530.
** Hoping to chase Iceland's Atlantic salmon in 2026? We currently have just a few remaining prime season rods available on Icelandic salmon rivers, including many of the top performers listed above. Reach out while the rods last.